 |
 |
Commentary
MCAD Industry View — A March 2006 Update |
by Drs. Russ Henke & Jack Horgan Henke Associates |
||
In the first MCAD Industry Commentary published May 2003 in MCADCafé.com, then-recent yearly and quarterly financial performances of a selected group of public Mechanical Computer Aided Design (MCAD) companies were analyzed and compared. Expectations of future financial performances of these same MCAD entities were documented. The May 2003 MCAD Commentary was followed by ten quarterly updates in MCADCafé.com, one for each subsequent calendar quarter. URL's on all past articles are available. The entities covered were ANSYS, Autodesk, Dassault Systèmes, UGS PLM, ESI Group, Moldflow, MSC.Software, PTC and Tecnomatix.
Due to the acquisition of Tecnomatix by UGS that closed April 1, 2005, Tecnomatix will no longer be covered here as a separate entity. While MSC.Software will be discussed in the article below, its financials will be omitted from the vendor comparisons because of MSC.Software's ongoing financial restatement issues.
Accordingly, the current article in the sequel recounts the financial performances of the remaining group-of-seven (G7) MCAD/PLM entities for the nominal fourth quarter of 2005.
Recent MCAD & PLM News Highlights
On March 2, 2005 Dassault Systèmes announced a merger agreement pursuant to acquire MatrixOne for $7.25 per share in cash, representing a total transaction value of approximately $408 million. The acquisition should be completed by the end of the second quarter of 2006, subject to customary closing conditions, including approvals by MatrixOne's shareholders and regulatory authorities. MatrixOne has 488 employees and 26 offices in North America, Europe and Asia Pacific. For its most recent fiscal year ended July 2, 2005, MatrixOne reported total revenues of $124.1 million. Cash and cash equivalents totaled $98.6 million at December 31, 2005. The revenue contribution from MatrixOne should give Dassault the clear lead in terms of mechanical PLM revenue. MatrixOne claims over 850 customers.
Authors' Comments on this acquisition: Dassault purchased mid-range mechanical CAD vendor SolidWorks in 1997 for around $310 million. At the time, SolidWorks had annualized revenues around $25 million. Since then, SolidWorks has operated with a high degree of independence. It uses a different sales channel and there is little in the way of product integration with CATIA, the Dassault's high-end CAD system. Dassault's PDM business (Enovia and Smarteam) generated ~$122 million in 2005. MatrixOne has a direct sales model versus Dassault's reliance on IBM (IBM business partners at the high end and VARs at the low end). By customer segment, MatrixOne revenue breakdown is: High Tech 49%, Automotive 23%, Aerospace/defense 12%, Industrial 10% and Consumer Products 6%. Dassault sees MatrixOne's strengths in semiconductor, medical, apparel and E&E as complementary. In attempting to explain how three distinct PDM/CPC product lines Enovia, Smarteam and MatrixOne fit together, Dassault has a chart something like the one shown below. The chart graphs two types of complexities.

Collaborative Business Process
Document x Workflow x User
Document x Workflow x User
It remains to be seen how the various products and the people will work together over time.
On February 16, 2006 ANSYS announced a definitive agreement to acquire Fluent, Inc., a global provider of computer-aided engineering simulation software, in a stock and cash transaction valued at approximately $565 million. In 2005 Fluent had a revenue growth rate of 16% and total revenue of $129 million (unaudited). Fluent is said to employ 750 people in 15 offices worldwide.
On February 7, 2006 Autodesk announced it has signed a definitive agreement to acquire Constructware for $46 million in cash, subject to a working capital adjustment. Constructware, privately held and based in Alpharetta, Georgia, provides on-demand communication and collaboration solutions that streamline design, construction and facility project management. The deal is expected to close in March 2006.
On February 1, 2006 Dassault Systèmes announced the appointment of Patrick Romich as CEO of its ENOVIA brand. Mr. Romich most recently served as an Entrepreneur in Residence with Warburg Pincus, LLC, where he was involved in sourcing deals in the engineering content space for the firm. He has served as chief executive officer for Synchronicity Software, Inc. and as CEO for IQXPERT. Since ENOVIA's inception in 1998, the role of CEO has been filled by Joel Lemke, who has also been General Manager for Dassault's PLM Americas organization since 2003. The appointment of Mr. Romich, will allow Mr. Lemke to focus on his executive role of building the PLM Americas team.
On January 17, 2006 Autodesk announced that Carl Bass, the company's chief operating officer, had been named president and chief executive officer, effective May 1, 2006. Bass also was immediately appointed to the company's expanded Board of Directors. Carol Bartz, who served as CEO since April 1992, will become the company's first Executive Chairman of the Board. Carl has been with Autodesk 10 years, most recently as COO. Before serving as COO, he was senior executive vice president of the Autodesk Design Solutions Group. Carl also served as chief strategy officer, chief technology officer and executive vice president of emerging business at Autodesk.
MCAD Vendors' Financial Performances in Q4 2005
As a group, the G7 MCAD vendors generated combined revenues of $1.37 billion in the fourth quarter of 2005, an impressive 15.5% increase over the $1.2 billion in the fourth quarter of 2004 and plus 15.1% over the $1.2 billion in the sequential third quarter of 2005. See Table 1.
| Company | Last
QTR Revenue |
Prev
QTR Revenue |
Last
vs. Prev QTR |
Comparable
2004 QTR |
Last QTR
vs. Comparable QTR |
| ANSYS | 44 | 39 | 12.0% | 39 | 12.4% |
| Autodesk | 417 | 377 | 10.5% | 356 | 17.0% |
| Dassault (€) | 304 | 214 | 42.3% | 240 | 26.8% |
| Dassault ($) | 362 | 261 | 38.8% | 312 | 16.1% |
| ESI Group (€) | 12.1 | 11.9 | 1.7% | 11.5 | 5.2% |
| ESI Group ($) | 14.8 | 15.0 | -1.5% | 14.0 | 5.2% |
| Moldflow | 16.9 | 15.3 | 10.6% | 16.3 | 3.9% |
| PTC | 193 | 195 | -1.3% | 169 | 13.8% |
| UGS PLM | 327 | 290 | 12.6% | 283 | 15.4% |
| Total | 1,373 | 1.193 | 15.1% | 1,190 | 15.5% |
Table 1 also reveals that all the vendors covered here showed year-over-year quarterly revenue growth. In descending order Autodesk, Dassault Systèmes, UGS, PTC and ANSYS enjoyed significant year-over-year revenue growth in the range of 12% to 17%. On a sequential basis, PTC and ESI-Group had about a 1.5% decline in revenue. Dassault, with its usual strong fourth quarter, led the group with 39% sequential growth. UGS, Moldflow, ANSYS and Autodesk had low double digit growth relative to the just prior third quarter.
Figure 1 below provides a bar graph showing the revenue trend for each of the covered vendors, for the periods mentioned in Table 1.

Figure 1 - Quarterly Revenues of the G7 MCAD Vendors
(US $ Millions)
(US $ Millions)
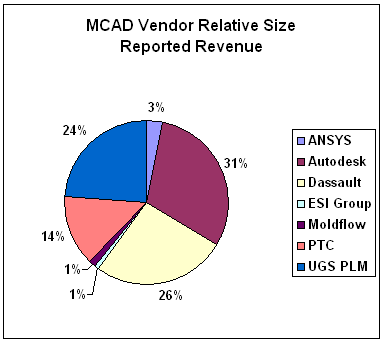
Figure 2 - Relative Sizes by "Q4" Reported Revenue
(Excludes MSC.Software)
(Excludes MSC.Software)
For the last quarter, Autodesk was the clear revenue leader with 31% of the total for the group. Dassault and UGS were neck and neck with 26% and 24%, respectively. (Figure 2)
(As always, it needs to be pointed out that unlike the other vendors in this report, Autodesk earns an important percentage of its revenue outside of the MCAD space. Autodesk does not break out its mechanical contribution. Also, both Autodesk and Dassault Systèmes sell mostly through third parties, while UGS sells mostly direct).
| Company | Last
QTR Earnings |
Prev
QTR Earnings |
Delta
Last vs. Prev |
Comparable
2004 QTR |
Delta
Last vs. 2004 |
| ANSYS | 13 | 11 | 2 | 12 | 1.0 |
| Autodesk | 83 | 94.5 | (11.5) | 65.8 | 17.2 |
| Dassault (€) | 69 | 37.8 | 31.2 | 60.1 | 8.9 |
| Dassault ($) | 82.1 | 46.1 | 36.0 | 78.1 | 4.0 |
| ESI Group (€) | N/A | N/A | |||
| ESI Group ($) | N/A | N/A | N/A | ||
| Moldflow | (0.1) | 0.0 | (0.1) | 1.6 | (1.7) |
| PTC | 7.5 | 17.3 | (9.8) | 19.2 | (11.6) |
| UGS PLM | 12.9 | (4.8) | 17.7 | 8.4 | 4.5 |
| Total | 198.7 | 164.3 | 34.4 | 185.3 | 13.3 |
See Table 2 for the earnings report. As a group, the MCAD vendors had earnings of $199 million, a modest 7% increase over the combined $185 million in earnings for the fourth quarter of 2004, and a 21% increase relative to $164 million in the sequential third quarter. All the vendors save Moldflow were profitable in the last quarter. Autodesk sported the largest year-over-year earnings percentage increase at 26%. ANSYS and Dassault were far behind at 8% and 5% earnings growth, respectively. PTC and Moldflow suffered declining earnings relative to the same quarter a year ago. On a sequential basis, all but Autodesk and PTC had improved earnings. Moldflow earnings were essentially flat.
Details on Individual Vendors' Q4 2005 Performances
On February 16, 2006 ANSYS, Inc. announced its financial results for the fourth quarter and the year, the periods ending December 31, 2005. Total revenue for the quarter was $43.7 million, an increase of 12% from the $38.9 million in the fourth quarter of 2004 and a 12% rise from the $39 million in the third quarter. The $43.7 million revenue for Q4 was above the guidance given in the prior quarter. Software license revenue at $24 million, accounting for 56% of total revenue, was up 11% year-over-year and 16% sequentially. Maintenance and service revenue at $19 million, accounting for 44% of total revenue, was up nearly 15% year-over-year and 7% sequentially. Repeatable revenue accounted for 60% of total revenue. The high end Multiphysics product line led revenue growth and was up 25% for the quarter and for the year.
All US offices except Houston had 20% year-over-year quarterly growth. Europe was up 14% year-over-year in real quarterly terms and up 20% for the year. When currency conversion is considered, the growth was 20% for both the quarter and the year. The percentage growth for year was 20% before and after currency effects. GIA grew 30% in the quarter and 23% in the year. Japan grew 26% in the quarter and 17% in the year. China had very strong growth. India had over 45% growth in both the quarter and in the year.
As reported above in News Highlights, on February 16, 2006 ANSYS announced a definitive agreement to acquire Fluent, Inc., a global provider of computer-aided engineering simulation software, in a stock and cash transaction valued at approximately $565 million. Under the terms of the agreement, ANSYS will issue six million shares of its common stock and pay approximately $300 million of net cash to acquire Fluent, subject to certain adjustments at closing.
On October 2005 the firm acquired substantially all of the assets of Harvard Thermal, Inc., a leader in thermal analysis software tools.
Jim Cashman, ANSYS President and CEO, said, "This past year was a period of significant growth for ANSYS in terms of continued advancement and expansion of technologies, as well as very solid financial performance. We completed fiscal 2005 with record results and continued strong momentum as ANSYS' value proposition gained further acceptance with our diverse, global customer base. The Company's overall performance in 2005 provides further validation that our business is operationally sound, financially strong and strategically on track."
On February 28, 2006 Autodesk, Inc. announced financial results for its fourth fiscal quarter ended January 31, 2006. For the fourth quarter, Autodesk reported record net revenues of $417 million, a 17% increase over $356 million reported in the fourth quarter of the prior year and 10% increase over the $377 million reported in the third quarter. On a constant currency basis, revenues increased 23% year-over-year. The $417 million was above the guidance given last quarter.
License revenue in the quarter was $336 million, accounting for 81% of total revenue. This was an 11% increase both year-over-year and quarter-over-quarter. Maintenance revenue in the quarter was $80 million, accounting 19% of total revenue. This was a 53% increase over the $304 million in the same quarter a year ago and a 9% sequential increase over the $377 million in Q3 2005.
| Segment | 4Q05 | 3Q05 | Delta | 4Q04 | Delta |
| Manufacturing | 74.4 | 63.3 | 17.5% | 60.1 | 23.8% |
| Platform | 192.4 | 181.3 | 6.1% | 174.3 | 10.4% |
The Platform segment, which accounts for nearly 50% of revenue, includes AutoCAD and AutoCAD Lite products that service multiple markets. Other segments are Building, Infrastructure and Media/Entertainment (previously named Discreet). The Manufacturing segment (which includes the Inventor product lines) grew 24% year-over-year and 18% from the prior quarter. A "guesstimate" of MCAD revenue would be about $140 million for the quarter.
| Geography | 4Q05 | 3Q05 | Delta | 4Q04 | Delta |
| Americas | 177.1 | 160.3 | 10.5% | 137.3 | 29.0% |
| Europe | 150.1 | 133.4 | 12.5% | 140.2 | 7.1% |
| AP | 89.6 | 84.6 | 5.9% | 78.7 | 13.9% |
| Total | 416.8 | 378.3 | 10.2% | 356.2 | 17.0% |
The Americas accounted for 43% of total revenue, Europe 36% and Asia Pacific 22%. All geographies had year-over-year and sequential growth. The Americas, with 29% growth relative to the same quarter a year earlier, was particularly strong.
Net income for the quarter was $83 million, a 26% increase from the $66 million in the fourth quarter of 2004, but a 12% decline relative to the preceding quarter's income of $94 million.
On February 9, 2006 Dassault Systèmes (DS) reported financial results for both the fourth quarter and the full year ending December 31, 2005. Total revenue for the quarter was €304 million, an increase of 27% from €240 million in the fourth quarter of 2004, and an increase of 42% from the €260 million in the third quarter. The €304 was near the high end of the guidance given last quarter. Software revenue at €252 million accounted for 83% of total revenue. This was an increase of 22% year-over-year and an increase of 38% sequentially. Service and other revenues at €52 million accounted for 17% of total revenue. This was an increase of 55% year-over-year and an increase of 70% sequentially.
On a geographic basis, the Americas accounted for 27% of total revenue, Europe 52% and Asia 31%. Year-over-year revenue from the Americas grew 25%, from Europe 35% and from Asia 28%.
Table 5 below shows the revenue by product segment. (Note Process Centric is the sum of CAD and PDM).
| € millions | 4Q2005 | 3Q2005 | Delta | 4Q2004 | Delta |
| Process Centric | 311 | 208 | 49.6% | 258 | 20.5% |
| CAD | 255 | 176 | 45.3% | 212 | 20.3% |
| PDM | 56 | 32 | 73.4% | 46 | 21.1% |
| Design Centric | 62 | 53 | 16.6% | 54 | 15.0% |
| Total | 373 | 261 | 42.9% | 312 | 19.5% |
Excludes amortization of acquired intangible assets and the effect of adjusting the
carrying value of acquired companies' deferred revenue.
New CATIA and SolidWorks seats licensed in the quarter increased 14% to 22,484 seats, compared to 19,726 seats in the year-ago quarter. PDM customer base (Enovia and Smarteam) increased significantly, with 40,000 new seats sold and 1,100 new customers in 2005.
DS completed the acquisition of ABAQUS Inc., the established leader in advanced finite element analysis software on October 4, 2005. The all-cash purchase price was US$413 million, before cash balances and tax benefits. ABAQUS, now a wholly-owned subsidiary of DS, employs about 500 people worldwide. ABAQUS contributed 22 million euros before deferred revenue write-downs.
In PLM, DS has taken on the role of channel management provider, or CMP on behalf of IBM. There are now over 2,600 people at Dassault Systèmes in services, sales, and marketing teams. These resources have increased by 34% in 2005. DS is now managing about 80 IBM Business Partners in eight countries. In total, this covers approximately 75% of the combined DS/IBM SMB business in Europe and the Americas.
Net income in the quarter was €69 million, a 15% increase from the €60 million in the fourth quarter of 2004 and an 82% increase from the preceding quarter.
Bernard Charles, President and Chief Executive Officer, said, "Looking ahead, 2006 will be a year of continuous transformation for Dassault Systèmes: Focusing on new product introductions to expand our V5 PLM offering for global collaboration; Enlarging our addressable markets with our "3D For All" initiatives; Paving the way to change and adopt our channel to create a new distribution model for small and medium-size enterprises, as well as providing full service solutions for large customers in all geographies across all sectors with our long-lasting partnership with IBM."
On November 15, 2005 ESI-Group reported results for the third quarter, the period ending October 31, 2005. Total revenue for the quarter was €12.1 million, a 5.2% increase over the same quarter a year earlier and a 1.7% increase over the prior quarter. The increase was driven entirely by organic growth. License revenue at €8.5 million, accounting for 70% of total revenue, was up 7.6% year-over-year but down 4.5% sequentially. License renewal rate was 81%. Service revenue at €3.6 million was flat year-over-year but up 20% from €3 million in the prior quarter. On a geographical basis, sales were Europe 46%, Asia 38% and America 16%. International sales were 82% of total sales.
For the first half of the year, the period ending July 31, 2005, operating losses were €1.7 million compared to losses of €1.5 million for the first half of 2004.
The Company's Alain de Rouvray said, "We will continue ongoing efforts to exploit synergies in the Group and to rationalise R&D spending while consolidating our market shares. The fact that we are maintaining our annual operating margin objective shows our determination to expand ESI Group according to a sound and profitable organic growth model. In a sector marked by new consolidation initiatives, ESI Group remains determined to continue building a decisive strategic advantage in the area of reengineering industrial design and manufacturing processes by digital simulation in order to speed up changeover to Simulation Based Design."
On February 2, 2006 Moldflow Corporation announced the financial results for its second quarter of fiscal 2006, the period ending December 31, 2005. Total revenue for the quarter was $16.9 million, compared to $16.3 million for the second quarter of last fiscal year, representing an increase of only 4%. However, the $16.9 million was up compared to $15.3 million for the first fiscal quarter, representing an increase of nearly 11% sequentially. The $16.3 million was about the center of guidance given last quarter. Product revenue at $10 million, accounting for 60% of total revenue, was up over 5% compared to the same quarter last year and up 15% compared to the just prior quarter. Services revenue at $6.8 million was up almost 2% year-over-year and up 4% sequentially.
Revenue from the Design Analysis Solutions segment represented 75% of total revenue and was $12.7 million, a 4% increase when compared to the same period last year and a 12% sequential increase.
Revenue from the Manufacturing Solutions segment totaled $4.2 million, contributing 25% of total revenue, and represented a 3% increase when compared to the same period last year and a 6% sequential increase.
Regionally, revenue in Europe represented 39% of total revenue, while revenue in the Asia/Pacific and Americas regions represented 31% and 30% of total revenue, respectively.
The net loss for the quarter was $109 thousand, compared to net income of $1.6 million a year earlier and compared to a net gain of $30 thousand in the just preceding quarter. Moldflow undertook a targeted restructuring of its business to reduce costs and streamline operations which resulted in a charge this past quarter of $1.3 million, net of related tax effects, primarily related to severance costs. There was also a charge of $579 thousand net of related tax effects, to recognize compensation expense as required under Financial Accounting Standards No. 123.
Roland Thomas, Moldflow Corporation's president and CEO, said, "I am pleased to report on the results for our second fiscal quarter of 2006 which were within our stated guidance range for both revenue and earnings. Our revenue, at the lower end of our expected range, was affected by unfavorable currency movements during the quarter, specifically in relation to the Yen and Euro. Strong revenue growth in our high gross margin Design Analysis Solutions business and an increase in the gross margin of our Manufacturing Solutions business, however, allowed us to achieve a non-GAAP earnings result in the mid-range of our guidance."
On December 22, 2005 MSC.Software Corporation announced that the filing of its Form 10-K for the period ended December 31, 2004 would be delayed several weeks. Its Forms 10-Q for the first, second and third quarters of 2005 were to be filed be shortly after the 2004 Form 10-K filing.
The Company had previously announced that it expected to file its 2004 Form 10-K and 2005 Forms 10-Q before December 31, 2005. The delay in the 2004 Form 10-K filing was not the result of any unresolved accounting or restatement issues, but rather the result of extra work required to confirm the accuracy of the restatements and financial reports, a Company spokesperson said.
Bill Weyand, chairman and CEO, said, "Although we are disappointed that we will make our filings several weeks later than expected, we are pleased that substantial progress has been made toward completing the restatement. MSC's new management team is dedicated to providing accurate financial reports. We are committed to the integrity of our financial procedures and precision in our financial reporting."
On February 1, 2006 MSC Software announced that it has entered into a definitive agreement to sell its wholly-owned Japanese service subsidiary, ESTECH Corporation, to Information Services International - Dentsu, Ltd. (ISID), a leading provider of professional consulting and reseller services in Japan. The purchase price was approximately $10.1 million.
On February 15, 2006 MSC.Software announced the appointment of Jack Varney as vice president, global learning and development. Mr. Varney was most recently the director of global sales training at Electronic Data Systems. He also held senior sales training and marketing positions at Standard Register and Pitney Bowes.
On January 25, 2006 PTC reported results for the first quarter of its fiscal year 2006. Total revenue was $192.5 million, up 14% from $169.2 million for the same period last year but down 1.3% from the $195 million in the just prior quarter. The $192.5 million was at the midpoint of the guidance given last quarter. License revenue was $58.5 million, accounting for 30% of total revenue. This was an increase of 25% year-over-year but a drop of nearly 4% sequentially. Services revenue was $134 million, accounting for 70% of total revenue. This was an increase of nearly 10% year-over-year and essentially flat sequentially.
Total Desktop Solutions revenue for the first quarter was $126.4 million, up 3% from the same period last year. Desktop Solutions license revenue grew 11% from the year-ago period to $36.1 million. The Desktop Solutions license revenue growth reflected increased sales of entry-level packages of Pro/ENGINEER as well as a significant transaction with a customer in Europe. Desktop Solutions accounted for 66% of total revenue.
Total Enterprise Solutions revenue grew 43% in the quarter to $66.1 million. Enterprise Solutions license revenue was $22.4 million, up 55% from the year-ago period. This exceptional performance reflects significantly accelerated revenue growth from Windchill PDMLink and Pro/INTRALINK products, as well as additional revenue from products acquired from Arbortext. Enterprise Solutions accounted for 44% of total revenue.
| 4Q05 | 3Q05 | Delta | 4Q04 | Delta | |
| Desktop | |||||
| License | 36.1 | 37.8 | -4.5% | 32.5 | 11.1% |
| Maint/Serv | 90.3 | 90.3 | 0.0% | 90.3 | 0.0% |
| SubTotal | 126.4 | 129.3 | -2.2% | 123 | 123 |
| Enterprise | |||||
| License | 22.4 | 23.9 | -6.3% | 14.4 | 55.6% |
| Maint/Serv | 43.7 | 41.9 | 4.3% | 31.8 | 37.4% |
| SubTotal | 66.1 | 65.8 | 0.5% | 46.2 | 43.1% |
Net income for the quarter was $7.5 million ,compared with $19.2 million in the year-ago period and $17.3 million in the prior quarter. PTC adopted FAS 123(R) in the fourth quarter of fiscal year 2005, and therefore the GAAP results from the year-ago period do not include the cost of stock-based compensation.
C. Richard Harrison, president and chief executive officer, said, "We are off to a great start to [fiscal] 2006. Our results reflect strong performance across product lines, with particularly outstanding performance in Windchill and our channel."
"We have begun to see strong benefits from the execution of our strategy and the investments we made in our business in 2005," continued Harrison. "We expect 2006 to be an exciting year for PTC as we focus on opportunities in our existing customer base, build momentum with Arbortext solutions, and work with our partner IBM to build a pipeline of business in China and targeted accounts around the world."
On January 25, 2006 PTC announced that its board of directors had authorized a two-for-five reverse split of its common stock.
On February 10, 2006 UGS reported its financial results for the fourth quarter and the year, the periods ending December 31, 2005. Total revenue for the quarter was $327 million, a 15% growth over the same period a year earlier and 12.8% growth over the prior quarter. The company's fourth quarter revenue included US$248.8 million in software revenue, or a 20% increase as compared to the fourth quarter 2004 and a 9.6% increase as compared to the third quarter. In terms of organic contribution and constant currency, revenue for the quarter was $310 million. The acquisition of Tecnomatix Technologies Ltd. that closed on April 1, 2005 added $68 million in revenue and $52 million in software revenue in Q4 2005.
License revenue at $114 million, accounting for 35% of total revenue, was up 13% year-over-year and 27% sequentially. Maintenance revenue at $134 million, accounting for 41% of total revenue, was up 26% year-over-year and 4% sequentially. Service revenue at $78 million was up 24% year-over-year and 10% sequentially.
cPDM revenue increased 47% including acquisitions, or 23% without acquisitions, over the same period a year earlier.
North America accounted for 42% of total revenue, EMEA 39% and Asia 19%. The Americas at $137 million, was up 18% year-over-year and 10% sequentially. EMEA at $128 million, was up 7% year-over-year and 16% sequentially. Asia at $62 million, was up 29% year-over-year and 13% sequentially.
Net income for the quarter was $12.9 million, up 54% year-over-year and a turnaround from the loss of $4.7 million in the prior quarter. EBITDA was $99 million, compared to $81 million in the fourth quarter of 2004 and compared to $64 million in the prior quarter. Adjusted EBITDA was $93 million. (EBITDA represents net income (loss) before interest expense, income taxes, depreciation and amortization. Adjusted EBITDA removes the impact of purchase accounting, currency and other adjustments).
Tony Affuso, chairman, CEO and president of UGS, said, "Today we celebrate our continued momentum and our first full calendar year as an independent company. In 2005, we claimed the number one spot in digital manufacturing and solidified our cPDM leadership. With our victory at Nissan, a hotly contested multi-year battle, we underscored our superior CAx technology and relentless focus on customer satisfaction. In 2005, we also highlighted the mission-critical nature of Global Innovation Networks through our new corporate vision, and launched our game-changing initiative bringing PLM to the mid-market."
MCAD Vendor Stock Performances
In Q4 2005, the combined stock prices of the MCAD vendors enjoyed an 18% rise in absolute dollars and 19% rise in average price, over Q4 2004. This compares to an average increase of 1.2% for the major stock indexes over the same period. MSC.Software had the greatest year-over-year increase at 62%, with ANSYS a strong second at 33%. Autodesk and Dassault Systems also had double digit growth. Moldflow was the only decliner at minus 12%. See Tables 7 & 8, and Figure 3 in the sequel.
On a sequential quarterly basis, the combined stock prices rose only 2% in absolute dollars but dropped nearly 1% in terms of average price. This compares to an average increase of nearly 2% in the major stock indexes. ANSYS, Dassault Systems and MSC.Software had growth around the 10% mark. Moldflow and PTC declined about 13%. Autodesk also declined, at minus 7.5%.
| Stock Sym | 4Q04 | 3Q05 | 4Q05 | QoQ | YoY |
| ANSS | 32.06 | 38.49 | 42.69 | 10.9% | 33.2% |
| ADSK | 37.93 | 46.44 | 42.95 | -7.5% | 13.2% |
| DASTY | 49.96 | 51.81 | 56.51 | 9.1% | 13.1% |
| MNSC | 10.47 | 15.72 | 17 | 8.1% | 62.4% |
| MFLO | 15.9 | 16.03 | 13.94 | -13.0% | -12.3% |
| PMTC | 5.89 | 6.97 | 6.1 | -12.5% | 3.6% |
| Total | 152.21 | 175.46 | 179.19 | 2.1% | 17.7% |
| Ave
Delta |
-0.8% | 18.9% |
(Note: UGS is no longer publicly traded)
| Index | 4Q04 | 3Q05 | 4Q05 | QoQ | YoY |
| DJI | 10,783 | 10,569 | 10,718 | 1.4% | -0.6% |
| Nasdaq | 2,175 | 2,152 | 2,205 | 2.5% | 1.4% |
| S&P | 1,212 | 1,229 | 1,248 | 1.5% | 3.0% |
| Ave
Delta |
1.8% | 1.2% |

Figure 3 - Stock Prices of MCAD Vendors
Calendar Full Year 2005 MCAD Vendor Performances
Note that the MCAD vendors have different fiscal years. The section below compares the last four reported quarters, nominally the calendar year 2005.
The combined revenues of the "G7" vendors in "calendar" 2005 were $4.89 billion, an impressive 18% rise from the $4.13 billion in calendar 2004. All members of the group had revenue growth relative to calendar 2004. Autodesk had the largest percentage growth at 23%. Dassault and UGS were just over 18%. Autodesk was the 2005 revenue leader at $1.5 billion. See Table 9.
| Rev $Millions | 2005 | 2004 | Delta |
| ANSYS | 158 | 135 | 17.5% |
| Autodesk | 1,521 | 1,234 | 23.5% |
| Dassault (€) | 944 | 797 | 18.5% |
| Dassault ($) | 1,170 | 988 | 18.5% |
| ESI Group (€) | 59 | 55 | 6.9% |
| ESI Group ($) | 75 | 68 | 10.2% |
| Moldflow | 66 | 59 | 12.9% |
| PTC | 744 | 672.4 | 10.6% |
| UGS PLM | 1,155 | 978 | 18.1% |
| Total | 4,892 | 4,133 | 18.3% |
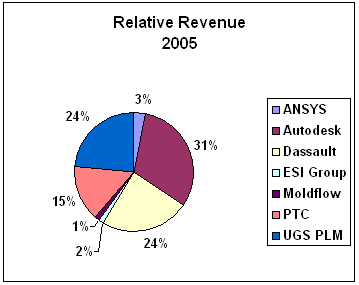
Figure 4 - Relative Market Share for Year 2005
Autodesk had the largest share, 31%, of the combined revenues. Dassault nosed out UGS with 23.9% versus 23.4%. See Figure 4. The big three accounted for 79% of the total.
| Earnings $ Millions | 2005 | 2004 | Delta |
| ANSYS | 43.9 | 34.6 | 9.3 |
| Autodesk | 328.9 | 221.5 | 107.4 |
| Dassault (€) | 175.5 | 156.4 | 19.1 |
| Dassault ($) | 217.6 | 193.9 | 23.7 |
| ESI Group (€) | NA | NA | |
| ESI Group ($) | NA | NA | |
| Moldflow | 3.3 | 5.0 | -1.6 |
| PTC | 80.5 | 72.0 | 8.5 |
| UGS PLM | (22.1) | (18.7) | (3.3) |
| Total | 652 | 508 | 144 |
The combined earnings for the G7 group were $652 million, a significant increase of 28% from the $508 million in 2004. Autodesk landed the largest earnings at $328 million and provided the greatest year-over-year increase at 48%. ANSYS was a strong second in terms of percentage earnings growth at 27%. PTC and Dassault had low double digit growth. See Table 10.
MCAD versus EDA
The three top mechanical CAD companies (Autodesk, Dassault Systèmes and UGS) sported revenues of $3.8 billion in 2005, 26% more than the $3 billion in revenue for the top three EDA companies (Cadence, Synopsys and Mentor Graphics). The MCAD vendors also generated over 9 times the amount of earnings. MCAD earnings were 13.6% of revenues compared to 1.9% for the EDA vendors. See below.
| 2005 | Rev | Earnings |
| MCAD | ||
| Autodesk | 1,523 | 329 |
| Dassault | 1,170 | 218 |
| UGS | 1,155 | (22.1) |
| MCAD Total | 3,848 | 524.9 |
| EDA | ||
| Cadence | 1,329 | 49.3 |
| Synopsys | 1,010 | 2.9 |
| Mentor | 705 | 4.3 |
| EDA Total | 3,044 | 56.5 |
Again, readers should keep in mind that Autodesk sells its products predominantly through valued added resellers and distributors. Dassault Systèmes sells predominantly through IBM and its Business Partners and in some instances, notably SolidWorks, through VARs. Thus, if one were to count actual end user purchases of the latter MCAD products, the combined MCAD revenue total would raise the Big 3 MCAD dollar total substantially. On the other hand, Autodesk has not-insignificant revenue outside MCAD in AEC, GIS and Media/Entertainment.
The comparison of earnings across the two industries is also difficult general due to a plethora of one-time charges associated with acquisitions. The earnings comparison for UGS is further complicated by purchase accounting adjustments related to its Venture Capital buyout from EDS.
Still, taken together, the hefty differences in revenues and earnings performances between the Top 3 MCAD and Top 3 EDA vendors largely overcome all the aforementioned caveats.
Individual MCAD Vendor Performances for the Calendar 2005 Year
For calendar 2005 ANSYS delivered total revenue of $158 million, or 18% over the $134 million in 2004. License revenue at $86 million was up 54%, and maintenance and service revenue at $72 million was up 164%. Net income for the year was $43 million, up 27% from the $34 million in 2004.
For calendar 2005 Autodesk created revenues of $1.52 billion, an increase of 24% over the $1.2 billion in 2004. License revenue at $1.2 billion was up 18%, while maintenance revenue at $277 million was up 57%. Net earnings for the year were $329 million, an amazing 48% increase from the $221 million in 2004.
For the calendar year Dassault Systèmes presented total revenue of €943 million (~$1.17 billion), an increase of 18% over the €796 million (~$988 million) in calendar 2004. Software revenue at €793 was up 18%, while services and other revenues at €151 million were up 20%.
| Rev $ million | 2005 | 2004 | Delta |
| Process Centric | 945 | 807 | 17.1% |
| CAD | 793 | 681 | 16.6% |
| PDM | 151 | 126 | 19.9% |
| Design Centric | 225 | 181 | 24.6% |
| Total | 1,170 | 988 | 18.5% |
Uses Average Currency Conversion Rates
Table 11 shows, for calendar 2005, that CAD represented 68% of Dassault total revenue, PDM 13% and Design Centric 19%.
During the year, DS reported sales of 34,798 seats of CATIA and 37,280 seats of SolidWorks, increases of 6.5% and 25%, respectively.
According to Bernard Charles, "Dassault Systèmes reported record revenues and earnings in 2005. Strong growth in software and services and core margin improvement drove our fourth quarter and full year financial performances. For 2005, our total revenues were 1.2 billion dollars, representing 19 percent growth."
Charles continued, "We extended our leadership of the Product Lifecycle Management market in 2005, gaining one percentage point in 2005 to 23 percent. In the aggregate, we have gained 8 points of market share over the last four years. And we extended our footprint in the design world, with over 72,000 new CATIA and SolidWorks licenses, demonstrating the continuous need for 3D technology across all industries."
For calendar 2005 ESI-Group reported total revenue of €59 million, a 7% increase over the €55 million in 2004. In terms of US dollars, total revenue was $75 million, an increase of 10% over the $68 million in calendar 2004.
For calendar year 2005 Moldflow delivered revenue of $66 million, a 13% increase compared to the $58.8 million in 2004. Net income for the year was $3.3 million, a 33% drop from the almost $5 million in 2004.
MSC.Software has yet to file financials for any portion of calendar 2005.
For calendar 2005 PTC provided total revenue of $744 million, a nice increase of 10.6% from the $672 million in 2004. Net earnings for the year were $72 million, a decrease of 8.5% from the $80 million in 2004.
For calendar 2005 UGS had total revenue of $1,155 million, up 18% compared to $978 million in 2004. From an organic and constant currency perspective, total revenue in the year was $1,079 compared to $978 the prior year. Software at $863 million accounted for 75% of total revenue and was up 21% over last year. Collaborative Product Development Management (cPDM) revenue increased 58% including acquisitions, or 37% without acquisitions, over the same period a year earlier. Net loss for the year was $22 million, compared to a net loss of $19 million in 2004. EBITDA was $242 million, up 37% from the $176 million in 2004. Adjusted EBITDA was $277 million, up 6% from the $261 million in 2004.
Stock Prices for the Year

Figure 5 - MCAD Vendor Stock Prices for 2005
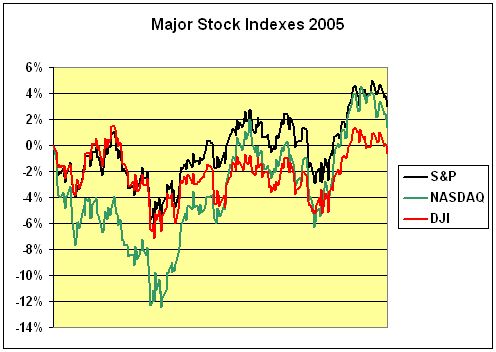
Figure 6 - Major Stock Indexes for Calendar 2005
Forecast Guidance from Individual MCAD Providers
As guidance ANSYS expects revenue for 2006 to grow 13%, to 14% growth to a range of $178 million to $180 million. This compares to $158 million in 2005. For the first quarter, ANSYS expects revenue in the range of $41 million to $42 million.
In discussing guidance, Autodesk pointed to three upcoming events in March: launch of AutoCAD 2007, end of retirement of AutoCAD 2002 and beginning of the retirement of AutoCAD 2004. For the first quarter the firm expects growth in the range of 20% to 23% (26% to 29% in constant currency) to between $425 million and $435 million. This compares to $417 million in the quarter just completed. Autodesk expects 18% to 20% growth for the year, with 6% coming from acquisitions.
As guidance Dassault Systèmes stated its objective to grow total revenues about 17% to 18% on a constant currency basis. This growth objective assumes approximately 7 points of growth from ABAQUS. This leads to a total revenue range of about 1.105 to 1.115 billion euros, before an estimated deferred revenue write-down of 8 to 9 million euros. For the next quarter, the firm's objective is to grow revenue 22% to 25% in constant currencies to about 248 to 253 million euros, based upon a US dollar to Euro exchange rate of 1.25 dollar per euro.
ESI-Group provided no guidance.
As guidance Moldflow expects revenue for its third fiscal quarter of fiscal 2006 to grow between 12% and 21% when compared to $15.9 in the same quarter last year. This $18.5 million also compares to $16.9 million in the quarter just completed.
MSC.Software provided no guidance.
PTC's revenue forecast for its second quarter of fiscal 2006 is between $195 million and $200 million. This compares to the $193 million in revenue for the quarter just reported. For the fiscal year ending September 30, 2006, PTC reiterates its previous guidance of revenue between $805 and $815 million.
UGS provided no guidance.
|
MCADCafé.com currently tracks the financial performance of multiple public companies in the Mechanical CAD market. Eight (8) companies were chosen for the author's May 8, 2003 Commentary. Four of these companies (Autodesk, Dassault Systèmes, PTC and EDS PLM Solutions -- now UGS, a privately held company) represented approximately 85 percent of the total revenue in this grouping, and each of these four companies offers a wide array of software and services products across the entire design to manufacturing space. The remaining four public companies (ANSYS, Moldflow, MSC.Software and Tecnomatix) offered specialized software/services products in specific MCAD niches and together they created the remaining 15 percent of the total group-of-8's revenue. Indeed, these latter four companies frequently partnered with the initial four to provide end-customers with broader solution suites. Tecnomatix has been acquired by UGS and hence has been removed from this report.
For the author's August 2003 Commentary in MCADCafé.com, a ninth company, the ESI Group, was added. All nine were studied thereafter for comparison purposes. The combined worldwide total annual revenue of these companies is over $4 billion, not an insignificant sum. But it is, in fact, less than 3 percent of the ~$190 billion spent annually on all types of software (source IDC). So why study MCAD companies at all? The key to MCAD's importance lies in the leverage its users apply to create the everyday durable goods with which we are all familiar: automobiles, trucks, military gear & weapons, appliances, farm & construction equipment, aircraft & aerospace vehicles, etc. In short, MCAD is arguably responsible for enabling today's manufacturing industries, which are the centerpieces of creating real productivity and wealth in every modern economy. Understanding the comparative MCAD revenue content of various vendors is not merely academic. For example, it helps observers better understand the likely future competitive MCAD strength of each vendor relative to its peers in such areas as amount of money available for R&D, for potential new acquisitions, for financial stability to weather economic cycles, and for other key business factors. In comparing financial performances of the four largest MCAD companies tracked by MCADCafé.com, it's instructive to account for the actual MCAD content of each. For example, the revenues of Dassault and PTC can arguably be considered 100% MCAD in nature, whereas Autodesk's total revenue is only partially made up from its business in MCAD. Some Autodesk revenue (~15%) stems from its Discreet Segment, which provides systems and software for creating and animating imagery. Even in the remaining 85% of Autodesk's total revenue, derived from its Design Solutions Segment, is divided among solutions for Manufacturing, GIS, the building industry, and the platform technology group. Only the solutions of the Manufacturing Group (Inventor, AutoCAD Mechanical, Mechanical Desktop, Streamline, Point A, etc.) might be thought of as "pure" MCAD revenue. It should also be noted that the companies have different business models. IBM, both direct and through Business Partners, is the exclusive marketing and sales arm for Dassault Systems high end product lines: CATIA, Enovia and Delmia. The IBM channel also carries SmarTeam solutions in a non-exclusive basis. IBM records the end user revenue and pays DS a royalty of approximately 50%. DS subsidiary SolidWorks is sold through value added resellers. Autodesk sells its products overwhelmingly through valued added resellers. The other MCAD vendors sell mostly on a direct basis. Direct sales result in greater percentage of end user revenue recognition but also involve higher cost of sales and risk. UGS annual revenues are right there at similar levels as the world's other MCAD revenue leaders Autodesk, Dassault and PTC. For purposes of our discussion, we considered the revenues from the remaining public companies (ANSYS, ESI Group, Moldflow, and MSC.Software) to be 100% MCAD. |
Geopolitical & Economic Factors:
The MCAD/PLM Industry is just one of many thousands of industries affected by geopolitical and economic factors around the world. Here in the United States, the last five years have resulted in far more than a baker's dozen enervating political and economic factors: (1) unremitting extravagance and unwarranted tax cuts in the face of the shift from US federal budget surplus to deep deficit, (2) the definite long-term trend of a rich-get-richer, poor-get-poorer US income distribution, (3) sluggish net job growth below the requirements of US population increases, (4) a net US disadvantage in globalization, (5) weakened US environmental stewardship and deteriorating US infrastructure, (6) the ballooning real and psychic costs of war, in lives and treasure, (7) reduced worldwide and domestic admiration for US leadership, with an astonishing lack of accountability, (8) the weaker US dollar, (9) elevated energy, oil & gas prices, (10) a deteriorated domestic NASDAQ market vs. 2001, (11) ongoing corporate fraud, (12) indictments and criminal investigations in both the White House and Congress, (13) double-digit rises in the cost of US health care and ongoing increases in the number of US uninsured, (14) stunning US federal incompetence (disaster relief, Medicare drug plan, nation building, ), (15) reduced US civil liberties and personal privacy, (16) unrelenting illegal immigration, and (17) record US trade deficits, requiring the US to borrow billions of dollars every week from abroad.
Things are not going so well recently, either.
In February 2006, the Bureau of Labor Statistics of the U.S. Department of Labor reported preliminary productivity data -- as measured by output per hour of all U.S. persons -- for the fourth quarter of 2005. In the fourth quarter, productivity declined 0.6 percent in the nonfarm business sector. The fourth-quarter productivity decline was the first since the first quarter of 2001.
On March 6, 2006 Bloomberg News announced that orders placed with US factories in January 2006 fell 4.5%, the biggest decrease since July 2000.
As reported by the San Francisco Chronicle, the final tally is in as of February 12, 2006, for item (17) above, the US Trade Deficit for the full year calendar 2005:

Almost everything about running a national trade deficit is bad. Among them: Countries that allow huge trade deficits can become too dependent on their creditors' good will, leading those debtor nations to federal decisions not in the debtors' national security interests.
Finally, here's the latest poll regarding Item (6) above, the ballooning real and psychic costs of war, in lives and treasure. An overwhelming majority of Americans believe that fighting between Sunni and Shiite Muslims in Iraq will lead to civil war, and half say the United States should begin withdrawing its forces from that violence-torn country, according to the latest Washington Post-ABC News poll announced March 07, 2006 by the Washington Post. The survey found that 80% believe that recent sectarian violence makes civil war in Iraq likely, and more than a third say such a conflict is "very likely" to occur. These expectations extend beyond party lines: More than seven in 10 Republicans and eight in 10 Democrats and political independents say they believe such a conflict is coming. In the face of continuing violence, 52% of those surveyed said the United States should begin withdrawing forces. The survey also found growing doubt that the Bush administration has a strategy in Iraq. Two-thirds of those interviewed said they do not think the president has a clear plan for handling the Iraq situation, the highest level of doubt recorded since the question was first asked three years ago. Nearly six in 10 disapprove of Bush's job performance, the 11th consecutive survey since last April 2005 in which at least half the country has been critical of his leadership. Americans also expressed disappointment with Congress, wherein both houses are of course controlled by Republicans. Only 36% of those Americans surveyed said they approve of the way Congress is doing its job, down seven percentage points in the past five weeks and the lowest marks for the legislative branch since October 1997. A total of 1,000 randomly selected Americans were interviewed March 2 to 5. The margin of sampling error for the overall results is plus or minus three percentage points.
####
Comments? Feedback? Tell us what you think about this topic, or share any additional information you may have on the subject! Submit your comments to: Email Form.
About the Authors
Since 1996, Dr. Russell F. Henke has been president of HENKE ASSOCIATES, a San Francisco Bay Area high-tech business & management consulting firm. During his corporate career, Henke operated sequentially on "both sides" of MCAD and EDA, as a user and as a vendor. He's a veteran corporate executive from Cincinnati Milacron, SDRC, Schlumberger Applicon, Gould Electronics, ATP, and Mentor Graphics. Henke is a Fellow of the Society of Manufacturing Engineers (SME) and served on the SME International Board of Directors. He is also a member of the IEEE and a Fellow of ASME International. An affiliate of the HENKE ASSOCIATES team since 2001, LA-based Dr. John R. (Jack) Horgan co-authored this article. Jack's career included executive positions at Applicon, Aries Technology, CADAM, and MicroCadam as well as a stint at IBM. Since May 2003 the authors have now published a total of thirty-nine (39) articles on MCAD, PLM, EDA and Electronics IP on IBSystems' MCADCafé and EDACafé. Further information on HENKE ASSOCIATES, and URL's for past Commentaries, are available at http://www.henkeassociates.net.