Welcome to GISWeekly!
GISWeekly examines select top news each week, picks out worthwhile reading from around the web, and special interest items you might not find elsewhere. This issue will feature Industry News, Top News of the Week, Acquisitions, Agreements, Alliances, Announcements, Financials, New Products, Around the Web, and Events Calendar.
GISWeekly welcomes letters and feedback from readers, so let us know what you think. Send your comments to me at
Email Contact
Best wishes,
Susan Smith, Managing Editor
Industry News
Managing Geospatial Infrastructure with Autodesk Map 3D 2009
By Susan Smith
Autodesk Map 3D is what the company calls its “desktop engineering platform,” meaning it is built on AutoCAD and includes a geospatial toolset. Mark Christian, product marketing manager for Map 3D, said that the product’s primary customers are concerned with infrastructure and infrastructure management, which includes government agencies, public works, public utilities, land planning, “basically anything where you’re managing some type of infrastructure or land, whether it be being the county assessor who is essentially managing parcels to engineering construction firms that are building a lot of the infrastructure, utilities, roads, etc., or small engineering firms.” Added to the mix are also environmental engineering firms. In northern California, many vineyards are using Map 3D for site assessment and planning.
AutoCAD Map 3D approximate install base percentages within each industry are as follows:
- Engineering and Construction: 40%
- Government: 35%
- Utilities: 18%
- Telecommunications: 7%
 [
Click to Enlarge ] [
Click to Enlarge ]
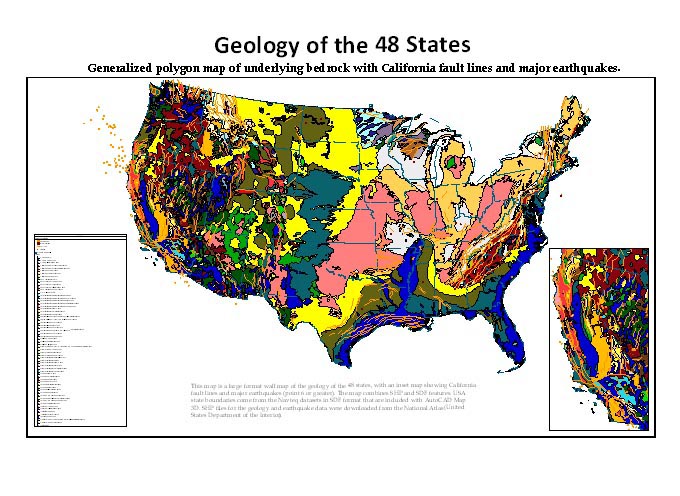
Map of the geology of the lower 48 states, USA with an inset map showing California fault lines and major earthquakes. Geology and earthquake data were downloaded from the National Atlas (United States Department of the Interior) in ESRI SHP file format. |
Christian describes Map 3D as a very horizontal product with functionality useful to many different disciplines. Civil 3D is built on top of Map 3D, and Topobase solutions are also built on top of Map 3D. Raster Design, used primarily as a raster editing, raster-to-vector conversion tool, is a type of extension to Map 3D. MapGuide completes the picture as the web mapping platform for publishing data out on the Internet or intranet.
Map3D is focused around engineering work process but has been optimized to work with spatial data. “For many GIS customers, we’ll say Map 3D is the tool that bridges CAD and GIS,” explained Christian. “A good 80% of our customer base uses Map 3D because they need an AutoCAD that can work with GIS information, whether that be georeferenced satellite or aerial imagery, information typically found in ESRI shape files, environmental information, zoning information, contour, soil information or any GIS data that is found outside the format of an AutoCAD DWG file.”
Basically people use Map 3D so they can use AutoCAD tools to manage geospatial data, thus, it doesn’t require a GIS-trained workforce, “You can use CAD trained workforce to manage geospatial data,” said Christian. Users can prepare design information for use in a GIS, whether it be an Autodesk GIS platform or ESRI or another one. The product is essentially used to move information back and forth between CAD and GIS.
 [
Click to Enlarge ] [
Click to Enlarge ]
Water and Wastewater System Map. Sample map covering the downtown area of the City of Redding, California, USA. The map shows water system infrastructure including pipe sizes. |
Feature Data Object (FDO) technology, an open source technology, is embedded in Map 3D, allowing what is called “direct data access.” This eliminates the need for an import/export routine, as users can directly and natively access the datastore. If the datastore is updated, they see updated information in real time on the screen.
Users can use AutoCAD tools to edit this information. In addition, there is a geospatial toolset, which consists of basic GIS tools such as buffer analysis, query (searching information), cartographic tools for creation of maps, and data management tools for databases such as Oracle, where they can create data models. This latter is the newest feature in the product and is not yet being maximized by users.
The most current popular use for Map 3D is to bring information from many different data sources into AutoCAD. Christian noted that since Map 3D is built on AutoCAD, every new feature and function in AutoCAD is also in Map 3D. The focus this year was on the user interface.
The user interface is designed for engineers who may not have been exposed to GIS language, such as what a query is, to perform operations they couldn’t do otherwise. If the user enters the information correctly, he/she can perform GIS or geospatial paths.
Examples of those actions are as follows: the user can browse data in ESRI shapefile format, bring it into Map 3D as parcel information, for example, which is georeferenced data in ESRI shapefiles. In the demonstration given by Christian, making use of FDO technology, 70,000 parcels were brought into Map 3D in seconds. When Christian highlighted over the parcels layer it gave him contextual information such as whether the file is an ESRI shapefile, and what coordinate system the data is in. Available are the data attributes listed in the data source, in this case the land values.
Other feature changes in the 2009 release are around data creation and editing. As a result, the complete AutoCAD toolset works on the FDO access data, so whether the user is accessing data that is in an ESRI ArcSDE managed database, Oracle database or in an ESRI shapefile, etc., the information can be brought into Map3D. The user can use the standard AutoCAD editing command to work on these functions.
Also added to 2009 is functionality around split and merge, so for someone doing land management, parcels, typical operations are parcel splits and parcel combines. To edit that geometry, Map 3D has some functions to help with polygon management.
Other data management capabilities include constraint based attribute creation of data. When drafting a new parcel boundary, all the attributes that need to be assigned to that parcel automatically go across and then by looking in the data model, the user can see a list of land values and then assign land values. “You can not only create the vector geometry which CAD has always been good at, but can also assign the attributes of that data intelligence during the drafting process,” explained Christian.
Commonly, Map 3D is used for data exchange, providing a common workflow through interdisciplinary groups. “Everybody has to deal with DWG files, whether it’s legacy or new files,” noted Christian, “but you have to move data back and forth between these different data types. Map 3D has been a vehicle for that for many years and we have enhanced this in the recent release. A lot of this is around not the vector geometry but rather, bringing attribute data back and forth between the FDO access data stores like ArcSDE, shapefiles, Oracle and SQLServer, and moving it back and forth, moving it into a drawing file so you can send it someone who just has standard AutoCAD so they can work with the information.”
Cartography or map creation is another area that has been updated in Map 3D. Users create maps in AutoCAD and in the past, have used competitive applications with it such as ArcView or even Adobe Illustrator. In the past couple of years Autodesk has developed a better cartography tool.
With cartography you’re creating a map based on underlying information, said Christian. These parcels are just vector geometry but there is a whole lot of data associated with them. “All the information that is associated with a certain parcel is in there, it’s just attributes,” said Christian. “It’s very common in GIS, in the CAD world a lot of times the attributes are separated from the geometry. Map 3D allows you to do things with that information, such as some simple analysis or cartography using these attributes.”
“You can quickly create a thematic map, by pulling information out of the map. There is also labeling. Map is about merging the CAD design world and GIS and to be able to not only edit the data, but also edit attributes and geometries, but to be able extract information out of that data before you even go to create a design. You may need to find out where x parcel is when you’re querying an entire database. Map gives you tools to find that information and bring that right into your project.”
Map 3D brings the ability to create metadata for AutoCAD drawing files, but also for any kind of data that we can actually work with in Map 3D, such as ESRI shape files. “Data management is always a huge challenge,” Christian pointed out. “We see many of our customers using Map with a central database such as Oracle to manage information, but that may just be the line, the point, the polygon, attributes values. Then there’s the idea of what is the descriptive information that a new user would want, whether it is a paper plot that is taken out by a field worker or whether it’s publishing information to the Internet. This is where our integration with Autodesk MapGuide comes into play.”
MapGuide also has some new capabilities, involving a flexible web layout that keeps users from getting “hung up” on terminology. “It lets somebody create a web application very easily, pretty much out of the box with a few clicks,” said Christian. “Map fits in as the aggregation, creation and editing tool and it lets you publish finished designs for finished maps to MapGuide for sharing on the Internet.”
Autodesk invested heavily in the API in this release. While many people do use Map 3D out of the box, Christian said that they also noted customers who were having solutions built for them by Autodesk consulting or independent software partner vendors. A series of geospatial APIs are available for people to build location and geospatial applications on top of Map 3D and MapGuide. “What is unique about our geospatial platform API is that essentially you write code once and that code can be utilized on the desktop or on the web environment,” said Christian. “This year we created more examples of how to use the API to fill gaps that are not in the UI of the product but are underlying for application developers to extend this product.”
Another feature of the new release are Industry Toolkits specific to industries such as electric utilities. These toolkits contain information such as overhead conductor, underground conductor, and a list of objects common to electric utilities, for example. The toolkits, which are a data model and a set of templates, can be used in Map 3D. The toolkits enable Map 3D to be an industry specific solution. Someone doing design work or data attribution work, can use the out of the box template of objects to draft with.
In a video demonstration, objects were being classified by taking the CAD object and giving it a data structure. “You can do a query on an object and find all the attribute information and fields that need to be filled in for asset management purposes. So for infrastructure lifecycle from design to build to operate and maintain, the terminology that are only used in the utility sector, why not include information that will need to be in a database somewhere for management of this infrastructure for a later time?” queried Christian. Map 3D with Industry Toolkits provides a platform to add this intelligence up front. “You don’t have to worry about what CAD layer you’re on, as an end user you just decide to create a new object, pick it from the right hand menu with all the other information you may need, the correct layer type, line type, colors, symbology, attributes, etc., is all assigned to those objects as they draft.”
There are three toolkits: electric utilities, water utilities and wastewater. All three are based on Topobase, an asset management system that is built on Map 3D that runs on an Oracle database on the back end. For customers who are not using a database with Map 3D, it’s possible to design and create their infrastructure in the CAD environment and retain attributes and information that can be moved over to a true database driven asset management system such as Topobase in the future.
Another new release for Map 3D is the Survey Toolkit. All the toolkits are extensions available for customers in the Autodesk Subscription program. The Survey Toolkit contains objects that can be used in an asset management solution but are centered around data aggregation or data capture.
Autodesk has made a huge move toward 3D and visualization within its product line, and it seems only natural that this would extend to Map 3D. Map 3D 2009 provides the ability to work with lidar data to create surfaces typical in site planning and site assessment, and to create thematic maps of the elevation data to understand the terrain better. Other ways to create a surface include using contour files in Shape file format to create a DTM, with a combination of surface information, vector information comprised of parcel outlines or road centerlines, to get a 3D view. Ultimately, after aggregating the data and bringing imagery into a single application, the maps can be shared by moving to another data format or publishing to the web.
Autodesk’s recent acquisition of 3DGeo will further the company’s visualization capabilities, coupled with some technologies that are already resident in some of the Autodesk product line.
Top News of the Week
Google.org has launched a new grants program for online mapping. Google.org Geo Challenge Grants will award small grants to non-profits and NGOs around the world to create projects using online mapping tools, such as Google Maps and Google Earth. The program is an open application process that will award grants up to $100,000. See
press release
Harris Corporation, an international communications and information technology company, introduced the Geospatial Data Access Retrieval Translator (GeoDART), a powerful new web-based search engine that enables geospatial information users to perform multiple searches, in parallel and across multiple data sources, using any service-oriented architecture (SOA) platform. The commercial off-the-shelf (COTS) product is designed for a wide range of government and commercial applications, including intelligence, oil and gas, agriculture, civil engineering, environmental protection and disaster response.
Acquisitions/Agreements/Alliances
The Survey of India announced that the Government of India had formally approved the strategic agreement between the National surveying and mapping organization Survey of India (SOI) and Tele Atlas Kalyani India Ltd., formerly Kalyani Net Ventures Ltd (KNVL) - a joint venture between the Kalyani Group and Tele Atlas. With this agreement Tele Atlas Kalyani India becomes the first Value Added Reseller (VAR) of India’s digital maps. The agreement allows Tele Atlas Kalyani India to release the first Survey of India-approved digital maps and custom map content within the public domain for commercial use in a range of navigation and location-based solutions in the mobile, internet, automotive, personal navigation system and enterprise markets.
Valtus Imagery Services is pleased to announce the establishment of a distribution partner agreement with Divestco Inc., whose portfolio of software and service offerings focus on the oil and gas industry.
DigitalGlobe announced that it has signed an agreement with deCarta, the leading supplier of software and services for the Location-Based Services (LBS) industry under which DigitalGlobe will provide deCarta's geospatial platform customers access to its premium, high-resolution satellite and aerial imagery.
Loopt, a revolutionary social-mapping and communication service, announced an agreement with SnapTrack Inc., a wholly owned subsidiary of Qualcomm, to use QPoint location-based server software to provide social mapping and other advanced location services. Loopt will help enable wireless carriers and a broader set of customers to provide certain high-performance, compelling location-based services (LBS). This agreement allows Loopt to address many of the economic challenges that have prevented the proliferation and success of high frequency, high accuracy location-based services.
Announcements
Pitney Bowes MapInfo announced that its Location Intelligence Component (LIC) now integrates with Xcelsius 2008, a data visualization tool from Business Objects, an SAP company, that enables users to create detailed and insightful dashboards from any data source. Organizations using Xcelsius 2008 can now combine business intelligence reporting, query and analysis environments with Pitney Bowes MapInfo’s location-based data, visualization and interactive spatial analysis capabilities to make more insightful business decisions.
NAVTEQ is reporting a significant and steady increase in the number of drivers updating maps for their navigation systems. NAVTEQ data shows that sales of navigation system map updates increased nearly 40 percent across both Europe and North America between 2004 and 2007.
Financials
GeoEye, Inc. reported that its revenues for the third quarter of 2008 were $35.9 million as compared to $53.8 million for the third quarter of 2007. See
press release
New Products
MetaCarta, Inc. announced a JavaScript Developers Toolkit that enables rapid development of GeoWeb applications on MetaCarta's Geographic Search and Referencing Platform (MetaCarta GSRP). GeoWeb applications are web-based, location-aware applications that help visualize trends, generate new revenue, drive premium services, and enhance intelligence analysis.
geoXMF LLC, an enterprise GIS performance company, announced the release of the latest version of its industry leading enterprise GIS performance monitoring software XMF Alerter 2.3.
geoXMF’s XMF Alerter is a complete enterprise performance monitoring and alerting solution for ESRI GIS. XMF Alerter integrates with and enhances ESRI’s industry-standard GIS architecture to deliver a comprehensive tool to improve overall IT efficiency and productivity.
GfK GeoMarketing recently released the GfK Europe Map Edition 2008/2009, which contains thousands of new additions and updates. With around 1,000 digital maps for 42 countries, the map set is an ideal instrument for precision regional planning and geomarketing activities.
GfK GeoMarketing recently researched the several thousand administrative boundary changes that have occurred over the past year across all of Europe. The result is the new GfK Europe Map Edition – a collection of over 1,000 digital maps of 42 European countries that reflects the many changes of the past year.
Tele Atlas announced the availability of Tele Atlas Urban Maps, designed to enrich the mobile users’ location-based services (LBS) experience. Urban Maps delivers premier out-of-car content such as enhanced views of sidewalks and footpaths, 2D representations of notable structures and building footprints that better orient pedestrians in city centers.
Bentley Systems, Incorporated announced V8i, described by the company to be the most comprehensive software portfolio for infrastructure ever assembled in a single release. Encompassing products for all of the solution communities served by Bentley, the V8i portfolio leverages and extends core capabilities of its new interoperability platform to provide the breadth and depth of technology needed for fully integrated project delivery. V8i’s interoperability platform enables Bentley applications to persist, share, and visualize infrastructure asset data in a common way, promoting collaborative workflows. The result is a project environment that combines flexibility, scalability, and robustness, and a portfolio that offers engineers, architects, GIS professionals, constructors, and owner-operators unprecedented choices across discipline-specific integrated software and services incorporated in Bentley solutions. Developed as a collective whole, the V8i software portfolio facilitates streamlined workflows among multiple disciplines and across project teams throughout the infrastructure lifecycle.
NAVTEQ announced an expansion to its dynamic content portfolio. Already a provider of camera alert data and real-time traffic to navigation systems, NAVTEQ now has Air Travel Status and Fuel Prices available for beta testing, with plans for commercial launch in Q1/09. Both products leverage formats that can be rapidly deployed, linked to NAVTEQ Map data and supported by NAVTEQ's 24x7 technical teams.
Apisphere Inc., a provider of location-awareness services for mobile business applications and devices, announced the availability of Apisphere for Outlook, a location aware plug-in for Microsoft’s Outlook messaging and collaboration client. Apisphere for Outlook enables users to send and receive automatic messages on their mobile devices or GPS-enabled laptops based on their Outlook calendar and location.
Around the Web
The OGC(R) Announces Successful OWS-6 Testbed Kick-off Event MarketWatch, Wall Street Journal, November 10, 2008
Events
| The 17th William T. Pecora Memorial Remote Sensing Symposium | |
| Date: | November 16 - 20, 2008 |
| Place: | Denver, CO USA |
|
This conference extends the William T. Pecora Memorial Remote Sensing Symposium tradition of emphasizing the applications and benefits of land imaging data. In addition, given the recent release of an Office of Science and Technology Policy report recommending the United States maintain a core operational capability for land imagery through the creation of a U.S. National Land Imaging Program, a special focus of Pecora 17 will be on the challenges of migrating satellite programs from reasearch missions to operational capabilities. |
|
| GeoAlberta 2008 – GIS Conference | |
| Date: | November 17 - 19, 2008 |
| Place: | Shaw Conference Centre
Edmonton, Alberta, Canada |
|
It’s time to inspire, innovate and collaborate at the 2008 GIS Conference, GeoAlberta will bring together over 500 GIS professionals from around Western Canada to discuss and collaborate on the latest in GIS applications, technologies and innovation.GeoAlberta is a collaborative effort between the four associations - the Alberta Chapter of the Urban and Regional Information Systems Association (URISA), the Alberta Chapter of the Geospatial Information Technology Association (GITA), the Alberta Geomatics Group (AGG), and GeoEdmonton. |
|
| Rocket City Geospatial Conference 2008 | |
| Date: | November 18 - 20, 2008 |
| Place: | Huntsville, AL USA |
|
The Rocket City Geospatial Conference will present a wide range of key topics of local and regional interest. The following list is presented as a guideline for proposed topics of discussion and for anyone interested in submitting a presentation:
|
|
| 2008 SHRUG GIS Work Shop | |
| Date: | November 19 - 20, 2008 |
| Place: | Tallahassee-Leon County Civic Center
Tallahassee, FL USA |
|
We invite you to join us at our seventh annual SHRUG GIS workshop "GIS Revolution". We want you to participate by being an attendee, a vendor, a speaker, and/or a poster presenter. |
|
| Houston Area GIS Day 2008 | |
| Date: | November 20 - 21, 2008 |
| Place: | University of Houston Central Campus
University Center 2nd Floor, TX USA |
|
This event is the largest showcase of how Geographic Information Systems are used in the City of Houston and surrounding areas. For two days, business people, educators, students, and the general public are given a free access pass to products and services that encompass GIS. |
|
| Mapping North Carolina Communities: An Introduction to GIS & Community Analysis - One Day Workshops | |
| Date: | November 20 - 21, 2008 |
| Place: | Knowledge Source
3100 Smoketree Court, Suite 200, Raleigh, NC 27604 USA |
|
This hands-on workshop focuses on teaching the fundamentals of using a Geographic Information System (GIS) for community analysis. Participants will learn to create thematic maps with Census data, Geocoding (Address mapping) and Spatial Queries. Other features of the workshop are learning to extract Census data and good map layout and design. |
|
| PORSEC 2008 | |
| Date: | December 2 - 6, 2008 |
| Place: | Ocean Hotel
Guangzhou, China |
|
PORSEC 2008, the Ninth Biennial Conference with the overall theme-Oceanic Manifestation of Global Changes, will be held in Guangzhou, China on December 2nd-6th, 2008, hosted by the South China Sea Institute of Oceanology (SCSIO), Chinese Academy of Sciences (CAS). |
|
| AU 2008 Annual User Conference and Exhibition | |
| Date: | December 2 - 5, 2008 |
| Place: | The Venetian Resort Hotel
Las Vegas, NV USA |
|
It’s the perfect opportunity for me to talk with customers from all over the world about their projects, their use of Autodesk tools, and the challenges they’re facing in their day-to-day work. |
|
| Mapping Massachusetts Communities: An Introduction to GIS & Community Analysis | |
| Date: | December 4, 2008 |
| Place: | Charles River Public Internet Center
154 Moody Street , Waltham, MA 02454 USA |
|
This hands-on workshop focuses on teaching the fundamentals of using a Geographic Information System (GIS) for community analysis. Participants will learn to create thematic maps with Census data, Geocoding (Address mapping) and Spatial Queries. Other features of the workshop are learning to extract Census data and good map layout and design. |
|
| Mapping Minnesota Communities: An Introduction to GIS & Community Analysis | |
| Date: | December 11 - 12, 2008 |
| Place: | New Horizons Computer Learning Center
4510 West 77th Street, Suite 210 , Edina, MN 55435 USA |
|
This hands-on workshop focuses on teaching the fundamentals of using a Geographic Information System (GIS) for community analysis. Participants will learn to create thematic maps with Census data, Geocoding (Address mapping) and Spatial Queries. Other features of the workshop are learning to extract Census data and good map layout and design. |
|